Is your feature request related to a problem? Please describe.
Currently there is no simple graphical way to monitor real-time network traffic inside the platform. Users who want to understand the amount of incoming and outgoing traffic need to rely on external tools, command-line utilities, or external monitoring systems. This makes it harder to quickly visualize spikes, anomalies, or general traffic behavior directly from the interface.
Describe the solution you’d like
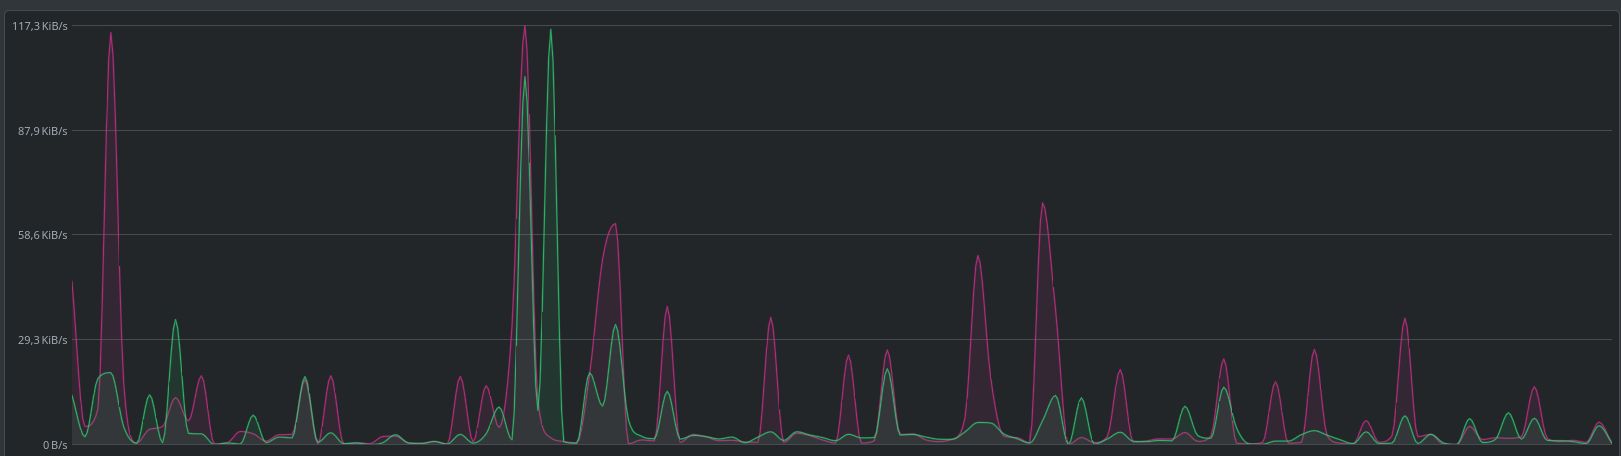
I would like to propose the addition of a GUI network traffic monitor that displays real-time bandwidth usage, similar to common system monitoring tools. The feature could include a live graph showing both inbound and outbound traffic rates (e.g., receive and transmit), allowing users to visually identify spikes, abnormal behavior, or usage patterns over time.
An example visualization would be a simple time-series chart with two lines representing receive rate and transmit rate, updating in real time.
Describe alternatives you’ve considered
Currently the only alternatives are using external monitoring tools such as system utilities (e.g., iftop, nload, or similar network monitoring tools) or setting up separate observability stacks like Prometheus and Grafana. However, these solutions add complexity and require additional setup outside the platform.
Additional context
A built-in graphical traffic monitor would improve usability and provide immediate insight into network behavior without requiring external tooling.